
Developments since CTS-2
2.1 CTS-3 is the third comprehensive transport study. The first study, which was completed in 1976, resulted in the decision to construct the MTR system and the realisation that it would be necessary to restrain private car travel. In 1986-89, the Second Comprehensive Transport Study (CTS-2) formulated a transport framework for the territory up to the year 2001 for a population forecast of 6.3 million. In view of the considerable uncertainties of transport planning at the time, in particular the future location of the territory's airport, the study recommended that the implementation of the strategy should be monitored and updated on a regular basis. Accordingly, from 1990 to 1993, the Updating of the Second Comprehensive Transport Study (CTS-2 Update) was undertaken to review the CTS-2 framework taking into account the relocation of the airport to Chek Lap Kok, Metroplan, and various reclamation studies. The planning horizon was also extended to 2011 for a population forecast of 6.6 million.
2.2 CTS-2 was a key study in the development of Hong Kong's transport policy and systems. Its recommendations formed the basis of the 1990 White Paper "Moving into the 21st Century". Many of the road and rail infrastructure recommendations of the White Paper have now been implemented, as shown in Table 2.1. The broad policy directions have also been generally maintained.
Table 2.1
Progress on Major Infrastructure
Recommendations of 1990 White Paper
| Recommendation | Progress |
| Highway Projects | |
| North Lantau Expressway and Lantau Fixed Crossing | Route 9 from Tsing Yi to Chek Lap Kok completed and open to traffic in 1997. |
| Route 3 to provide a major north-south link between the boundary and Hong Kong Island | Completed and open to traffic in phases between 1997 and 1998. |
| Hung Hom Bypass | Opened in 1999. |
| Route 7 Kennedy Town to Aberdeen | Land unavailable – planned completion date 2010. |
| Central – Wan Chai Bypass and Island Eastern Corridor Link | Land unavailable – planned completion date 2010. |
| Route 16 between Sha Tin and West Kowloon | Now part of Route 9. Detailed design currently in progress with construction expected to be completed by 2005. |
| Railway Projects | |
| Airport Railway/Tung Chung Line | Completed in 1998. |
| MTR Tseung Kwan O Extension | Under construction, due to be completed in 2002. |
| West Rail (Phase I) connecting NWNT and Tsuen Wan | Under construction, due to be completed in 2003. |
2.3 CTS-2 and the subsequent 1990 White Paper laid out broad transport policy directions which have helped keep Hong Kong moving. However, Hong Kong has developed more rapidly than was envisaged in CTS-2. For example, the population forecast for 2001 at the time of CTS-2 was 6.3 million. This figure was actually reached in 1996 and the forecast for 2001 is now close to 7 million. The upper limit of population tested during CTS-3 is 10.1 million in 2016. To plan for a higher population, several major planning studies have been carried out in recent years. The most important of these is the Territorial Development Strategy Review (TDSR), which was completed in 1996. Other key studies include the First and Second Railway Development Studies (RDS), and the Crosslinks Further Study1.
(Note: 1. The Study is formally known as Feasibility Study for Additional Cross-border Links)
2.4 To cope with these changes in our future development, we need a comprehensive transport study to help produce a cohesive and comprehensive transport plan. CTS-3 extends the planning horizon to 2016, taking into account a wider range of considerations to meet the changing aspirations of society, especially the effect of transport on the environment and the need to integrate land-use, transport and environmental planning. It aims to produce a framework for developing a strategy that not only meets the traditional objective of maintaining mobility but does so in an environmentally acceptable and sustainable way.
Existing Situation
2.5 CTS-3 adopted 1997 as the base year to which future conditions are compared. Despite rapid development, average 1997 traffic speeds are comparable to those 10 years ago (about 26-30 km/h in heavily urbanised areas and 32 km/h elsewhere in the peak hour), testimony to the success of Hong Kong's transport planning and an expanding infrastructure programme. Furthermore, there have been considerable improvements to public transport services, including a more comprehensive railway network and provision of parking at railway stations. (Public transport is estimated to carry around 90% of all person trips in 1997. The number of observed public transport boardings is about 11 million per day). However, due to the lack of progress on some of the projects recommended by CTS-2, and because of faster than expected population and economic growth, some areas suffer from severe congestion (e.g. Central, Wan Chai, Causeway Bay, Lion Rock Tunnel and the Cross Harbour Tunnel). Sections of the MTR system also suffer from overcrowding at peak times (e.g. along the Nathan Road Corridor before opening of Tung Chung Line in 1998).
Assumptions and Forecasts
2.6 The demand for transport services is closely related to Hong Kong's development pattern. As development types or intensities change, transport system improvements may be needed to better link areas of growth with the remainder of the region. CTS-3 uses estimation procedures refined from CTS-2 and its Update that determine passenger and goods travel demands based on the distribution of development types and intensities within the region, taking into consideration the changed trip making behaviour observed in the course of validation of the transport model against 1997 traffic conditions.
2.7 The future is driven by too many variables to be accurately predicted. It is difficult to foresee events that will occur or conditions that will exist in 15-20 years time. CTS-3 has therefore adopted an approach different from CTS-2. Instead of relying on historical trends, CTS-3 examined a wide range of development scenarios incorporating assumptions defining the key determinants of future travel demand. The value of using different scenarios is the contrasting pictures they paint and the diverse implications they suggest. The intention was to address an envelope of assumptions and identify alternative (related to low, medium and high travel demand growth) combinations of infrastructure investments and demand management policies. As Hong Kong moves forward, and levels of economic and other developments are better determined, Government can use the scenarios and packages to build a robust and flexible strategy that best meets transport mobility, economic, financial, budgetary, social, environmental and public acceptance objectives.
2.8 Several areas of uncertainty exist that were considered in defining an envelope of study assumptions. These include growth in Gross Domestic Product (GDP), population, private vehicle fleet, goods vehicle fleet and cross boundary traffic.
2.9 Gross Domestic Product - GDP growth provides an indication of the increase that can be expected in private vehicle ownership and goods/commercial vehicle movements. GDP forecasts also indirectly affect several of the other variables used in the demand forecasting process. When real increases in GDP are experienced personal incomes increase. These increases have an effect on the transportation choices people make in meeting their day to day travel needs.
2.10 Three GDP growth scenarios were developed. These are illustrated in Figure 2.1. These scenarios were based on the best possible estimations available and with Government inputs. Future growth rates will likely fall within the envelope of these estimations. The low scenario represents a 'what-if' very low growth rate assumption. The medium reflects the central assumption of likely GDP growth, based on past trends and future economic outlook. The high estimate is based on past trends with only short term adjustment in response to the current economic down turn. However, it must be recognised that long term GDP growth rate is difficult to forecast.
2.11 The forecasts range from an average annual (from 1997-2016) growth rate of 2.4% for the low scenario, 4.4% for the medium scenario to 4.9% in the high scenario. Average household income (in real terms) is forecast to remain constant (to 1997 levels) under the low GDP growth assumption. Under the medium and high assumptions household incomes would increase above 30% by year 2016.
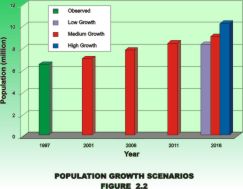
2.12 Population - Growth in population translates directly to an increase in transport demand. The related increases in employment and students result in more trips to and from work and school. Shopping and recreational trips also increase.
2.13 As shown in Figure 2.2, CTS-3 considered three scenarios with 2016 populations ranging from 8.2 to 10.1 million, with the land-use planning data prepared by the Planning Department. The low development assumptions (identified as Scenario I) were prepared based on projections developed by the Census and Statistics Department and assume a 2016 population of about 8.2 million. Under the study's medium development assumptions (identified as Scenario II) population is expected to grow to about 8.9 million by 2016 and takes into account the estimated capacity of the existing, known and planned sites for meeting Government's housing target. The high population forecast of 10.1 million (identified as Scenario III) is intended to represent a long term development scenario for Hong Kong which may eventually materialise beyond 2016.
2.14 Ownership and Use of Private Vehicles - A key determinant of travel demand (particularly road usage) is the extent to which Hong Kong people own and use private vehicles. People with access to private vehicles make more trips and are less likely to use public transport. Both of these car ownership effects increase road usage.
2.15 Stated simply, private vehicle ownership and usage increases produce an increased level of road congestion, a greater need for new road infrastructure and an increased burden of air pollutants on the environment. However, private cars often provide a higher level of travel comfort and convenience that the public finds desirable and valuable. As incomes increase more families will find car ownership affordable and will choose to use their disposable income to purchase cars.
2.16 Apart from the uncertainties in long term GDP (and therefore household income), there are also other constraints on private vehicle ownership (related to environmental issues for instance) that may cause Government to manage the ownership and use of private vehicles.
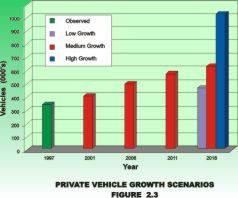
2.17 CTS-3 considered three alternative private vehicle growth rate assumptions. The high scenario relates private vehicle growth to GDP and ownership costs, a methodology which has been generally well-proven worldwide, and was found to perform well in Hong Kong in estimating private vehicle fleet size in the past two decades. This scenario represents the possible fleet sizes if no additional restraints are placed on car ownership and if economic growth extends through the planning horizon. The medium scenario was taken from the TDSR and it reflects a possible fleet size considering the geographic constraints of Hong Kong. The low scenario assumes that private vehicles increase at the same rate as population. Figure 2.3 shows the estimated fleet sizes under these three growth scenarios.
2.18 Goods Vehicle Usage - The ongoing restructuring of Hong Kong's industrial and commercial base imposes an additional degree of uncertainty on forecasting of goods vehicle usage, over and above the normal uncertainties associated with forecasting future events.
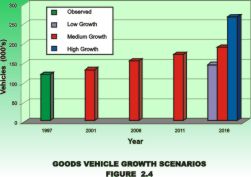
2.19 Three goods vehicle fleet sizes were considered in the preparation of future year forecasts. The high assumption was that goods vehicles would increase according to observed relationships linking goods vehicle growth to GDP growth. A strikingly good correlation was observed for decades until the mid 1980s. Goods vehicle growth has slowed down considerably in recent years. It is therefore necessary to find suitable medium and low assumptions to complete the envelope of assumptions. The medium assumption was that fleet size growth rates would be as estimated in the Freight Transport Study (FTS), which assumed that the goods vehicle fleet would be increasing at a slower pace than the growth in GDP and that the freight transport demands would be fairly responsive to future cost increases. The FTS considered that this case would represent the best estimate of the future situation, given the implementation of committed and planned infrastructure schemes. The low fleet recognised the fact that goods vehicle growth has become virtually stagnant in recent years but allowed for moderate growth in future. It thus assumed a growth rate equivalent to half the predicted increase in employment from 1997 to 2016. The resulting three goods vehicle fleet sizes, by forecast year, are shown in Figure 2.4.
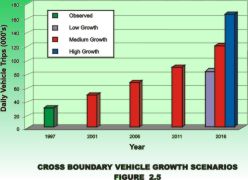
2.20 Cross Boundary Traffic - 2006-2016 cross boundary vehicle traffic estimates were taken from the Crosslinks Further Study, whilst 2001 estimates were derived by interpolation. That study produced low, medium and high estimates (related to differing assumptions regarding economic and trade growth for Guangdong as a whole and for regional economies within Guangdong). Figure 2.5 shows forecasts for the daily cross boundary traffic.
2.21 Summary of Study Assumptions Envelope - Three forecasting scenarios were defined using combinations of the assumptions described above. These low, medium and high growth scenarios are shown in Table 2.2. Also shown are 1997 values for each variable.
Table 2.2
Envelope of Forecasting Assumptions
| Scenario 1 | GDP Average Annual Growth Rate 1997 - 2016 | Population | Fleet Size | Total Daily Cross Boundary Vehicle |
| Private Vehicle 2 / Goods Vehicle | ||||
| 1997 | -- | 6,425,000 | 327,000 / 117,000 | 30,000 |
| Low 2016 | 2.4% | 8,184,000 | 455,000 / 141,000 | 85,000 |
| Medium 2016 | 4.4% | 8,934,000 | 618,000 / 185,000 | 120,000 |
| High 2016 | 4.4% - 4.9% | 8,934,000 -10,130,000 | 960,000 - 1,084,000 / 262,000 | 120,000 - 164,000 |
Note:
1. In view of the various possible combinations of major assumptions, CTS-3 has tested a large number of scenarios. Of these scenarios, only the most representative three have been selected for presentation in the Final Report.
2. Private vehicles include private cars and motorcycles.
3. The figures are rounded to the nearest thousand.
2.22 The three scenarios defined in the Table 2.2 formed the basis for developing alternative programmes of infrastructure investments and demand management policies. In addition, sensitivity tests were undertaken to examine impacts of scenarios not appearing in the table.
Do Nothing Scenario
2.23 An initial set of demand forecasts was prepared. These forecasts examined the conditions that would exist if only 'committed' infrastructure projects are assumed to be implemented (through year 2016) and no changes to existing demand management policies are adopted. For these tests 'committed' was defined to include projects under construction or at detailed design stage as of 1997. Figure 2.6 shows the railway and strategic road improvement projects which have territorial transport implications, assumed to fall in the 'committed' category.

2.24 The extent of problems under the 'do nothing' scenario would be dependent on the choice of other forecasting assumptions. In order to appreciate the full extent of possible problems to pave the way for detailed model analyses of various combinations of assumptions taken from the established envelope, the high 2016 assumptions given in Table 2.2 were adopted.
2.25 A summary of growth (from 1997-2016) in key determinants and measures of travel demand is shown in Table 2.3.
Table 2.3
1997-2016 Travel Growth
(Committed Infrastructure Only)
| Variable | Units | 1997 | 2016 | Ratio 2016/1997 |
| Population | 1,000 ' s | 6,425 | 8,934 | 1.39 |
| Daily Person Trips 1 | 1,000 ' s | 11,630 | 18,100 | 1.56 |
| Private Vehicles | 1,000 ' s | 327 | 960 | 2.93 |
| Daily Private Vehicle Trips | 1,000 ' s | 934 | 1,800 | 1.93 |
| Goods Vehicles | 1,000 ' s | 117 | 262 | 2.24 |
| Daily Goods Vehicle Trips | 1,000 ' s | 709 | 1,590 | 2.24 |
| Daily Cross Boundary Vehicle Trips | 1,000 ' s | 30 | 120 | 4.00 |
| Daily Public Transport 2 Boardings | 1,000 ' s | 10,859 | 19,157 | 1.76 |
| Daily Rail (MTR, KCR, LRT and Tram) Boardings | 1,000 ' s | 3,579 | 9,825 | 2.75 |
Note:
1. A trip is made from an origin to a destination, and may involve boarding onto one or more modes of transport.
2. Public transport includes rail (MTR, KCR, LRT and Tram), franchised and non-franchised buses, minibuses, taxis and ferry services.
2.26 As different transport modes have different occupancy characteristics, both person trips and vehicle trips are used as indicators of the transport demand for planning purposes. Person trips are forecast to increase at a faster rate than population (a 56% increase versus 39%). This reflects the impacts of higher personal incomes, higher private vehicle availability and smaller household sizes (and therefore a larger number of households for the same population) on trip making behaviour. Private vehicle trips are forecast to increase at an even higher rate (93%). This higher growth rate reflects the increased availability of private vehicles.
2.27 Rail boardings are forecast to increase at a higher rate than total public transport boardings (175% versus 76%). Increased use of rail is partially a function of the rail system expansion (West Rail in particular) included in the definition of committed projects. Additionally, high levels of congestion on the road system discourage bus use and divert some passengers to the rail system.
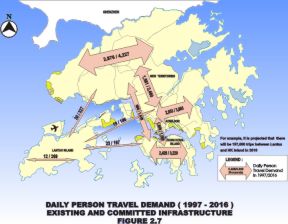
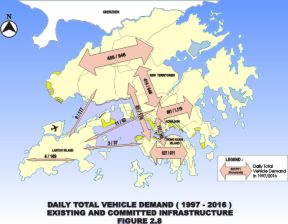
2.28 Figures 2.7 and 2.8 show 1997 person and total vehicle demand (between major geographic areas - Hong Kong Island, Kowloon, the New Territories and Lantau Island) compared to 2016 estimates. The largest increases in demand are noted for travel to, from and within the New Territories.
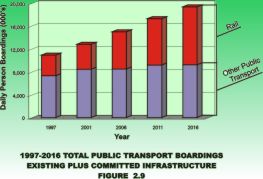
2.29 Public Transport Usage - Figure 2.9 shows total public transport and rail boardings from 1997 through 2016 under the 'do nothing' high scenario. Public transport patronage is forecast to increase about 76% over this period. Rail boardings will increase about 175%. The overall public transport mode share for both 1997 and 2016 would remain at about the same level of around 85% to 90%. Rail share of total public transport boardings is forecast to increase from 33% in 1997 to about 50% in 2016.
2.30 Extensive rail capacity deficiencies are forecast to occur (by 2016) at several locations, the most significant of which are:
 |
Tsuen Wan Line (between Mong Kok and Admiralty stations) |
|
Kwun Tong Line (between Shek Kip Mei and Prince Edward stations) |
|
Island Line (between North Point and Causeway Bay stations) |
|
Tung Chung Line (between Yam O and Tsing Yi stations) |
2.31 It should be noted that the high usage of the rail system (and related capacity deficiencies) is primarily a function of the very low bus speeds that will occur under this scenario, since the road speeds reported above also will severely reduce bus speeds. In effect, the only public transport service operating at a reasonable speed is rail. Therefore, rail attracts very heavy usage.
2.32 Again, the combination of rail system capacity deficiencies and low bus operating speeds observed for this test scenario suggest an unacceptable level of mobility.
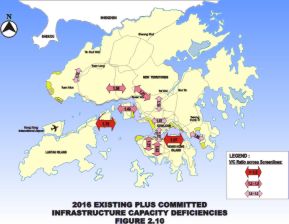
2.33 Highway Traffic Flows - Figure 2.10 shows the impact of the demand increases under the 2016 'do nothing' high scenario on the existing plus committed highway network. The figure shows morning peak hour volume to capacity ratios. A ratio over 1.0 indicates that insufficient roadway capacity exists to meet the estimated demand. Widespread capacity deficiencies are forecast to exist in most major travel corridors. These deficiencies lead to congestion and decreased travel speeds.
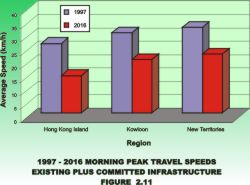
2.34 Figure 2.11 shows the average morning peak hour travel speeds that can be expected to accompany the capacity deficiencies produced by the committed network (and no new demand management policies). Hong Kong Island travel speed is forecast to decrease from about 26 km/h in 1997 to 14 km/h in 2016. Kowloon speed would decrease from 30 km/h to 20 km/h and New Territories from 32 km/h to 22 km/h.
2.35 The combination of capacity deficiencies and road speed reductions noted above indicate that acceptable levels of mobility will not be achieved without additional infrastructure and/or new demand management policies under the 2016 'do nothing' high scenario.
Note: The information of the report was valid at the time when it was published. It might not remain so as at the date when this webpage was reviewed / revised. Please refer to the first page of the report for its publication date.